Leucius Charinus wrote: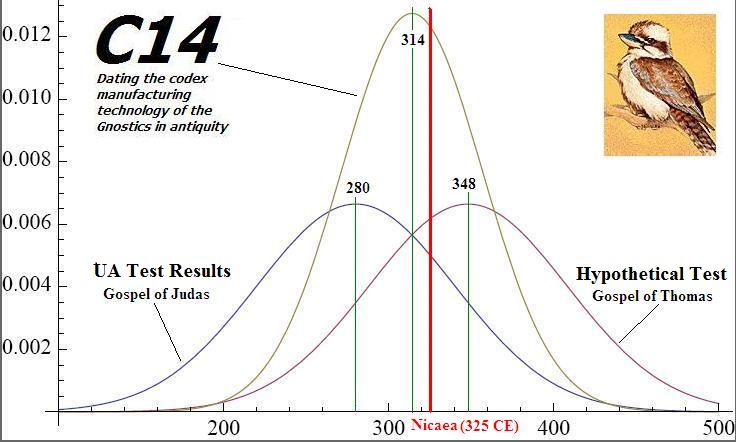
As you have noted I had a large number of discussions about the theory behind combining two C14 dates.
We don't have two dates - due to an error on my part - but the theory behind this is interesting.
Hopefully another result will be obtained and it can be plugged in to this calculation.
Unless the principles behind the validity of the calculation can be shown unsound.
Actually it does look completely invalid on principle, IMO.
I'd have to develop the math behind it (and we'd need numbers to start with), but...
When we're discussing several different manuscript dates, in terms of what they tell us for the age of the underlying text...
(a) We are
not interested in an average.
(b) We
are interested in the earliest such manuscript.
As such, for every given manuscript find, it can do one of two things:
(a) It can push the terminus ad quem for the underlying text lower, on the basis of the manuscript find.
or (b) It can tell us nothing at all.
If I were to redo a chart like that, and if I had actual data with which to redo it...
It wouldn't have a normal distribution.
Instead, it would look more or less like an asymptotic graph.
The earliest dates would be "100% consistent" (or near-to) with the manuscript finds. There would be no manuscript finds that rule out such dates.
However, as we pass into the area under the curve of the dating of a manuscript, this leads to less-than-100% consistency. The manuscript can disprove such a late dating of the underlying text.
So we would have a part of the chart where the probability that such a date is ruled out by a manuscript date is between 0% and 100%.
At near-100% chance of being ruled out by a manuscript find's date, the graph would approach 0% chance of a possibility of the date of the underlying text's date.
Basically, it doesn't matter if you find an 8th or 18th century copy of the Gospel of Thomas or the Gospel of Judas or the Gospel of Bob or whatever. It's not going to pull the date of the original forward (
especially when we already know there's an earlier manuscript). That's nonsense.
Now I know you have had some ideas before on measuring the likelihood of various lapses of time between the original and the first known manuscript, but that's not really where you have to start.
You have to start with finding the range of probable dating that we assign to the first known manuscript; or, and getting towards the same general concept, you need to graph the likelihood that
any of the manuscripts that are known could have dated to a given year (with this info for each year). And the chart above is not how we do that. In fact, the Nag Hammadi find, if it overlapped with the Codex Tchacos find, should have pushed the graph (in the part where they overlapped--it would no longer be a normal distribution) to the left (compared to the graph of the dating of Codex Tchacos), not to the right.
I.e., in the dates where it is possible that
either manuscript came from that date, and where we want to figure out the date of the
first manuscript of the two, the later dates on the Tchacos curve (the ones later than the earliest possible dates for NHL) are made
less likely to be the date of the
earliest manuscript (we don't know which that is!) because you must account for the odds that the first manuscript wasn't Tchacos but actually Nag Hammadi,
in the range where it is possible that NHL is before Tchachos. (I'm sorry if this explanation doesn't make a whole lot of sense. I'd be happy to work on the math sometime, as it is genuinely interesting.)
Also, your graph cuts off prematurely on the left-hand side, as the first manuscript could have been earlier than the first possible date for NHL.
What your graph
does show (whether it was meant to or not) is what the likely date is for both Tchacos and NHL (given their starting curves), assuming that they were made in the same year. That's sort of a non-starter. It's silly to assume that they were from the same year. Now I know that's not what you are trying to graph. But it's also a bit silly, accordingly, to assume that this graph represents what you are trying to find.
 Papyrus from interior of leather cover: AD 209 +/- 58 years;